| Plant Life Cycle Anchor Chart |
|---|
| A plant life cycle anchor chart is a visual aid that shows the different stages of a plant’s growth and development, from seed to flower. |
| Creating your own plant life cycle anchor chart can help you learn more about the plant life cycle and enhance your creativity, observation, and scientific skills. |
| You can create your own plant life cycle anchor chart in five easy steps: |
| 1. Choose a plant to observe |
| 2. Plant the seeds and monitor the growth |
| 3. Identify the stages of the plant life cycle |
| 4. Create the plant life cycle anchor chart |
| 5. Display and share the plant life cycle anchor chart |
Do you want to learn more about the life cycle of plants? Do you enjoy making your own projects and experiments? If you answered yes to both questions, then you will love this article. In this article, you will learn how to create your own plant life cycle anchor chart, a visual aid that shows the different stages of a plant’s growth and development, from seed to flower.
A plant life cycle anchor chart can help you understand how plants change and reproduce over time. It can also help you remember the names and features of each stage. Creating your own plant life cycle anchor chart can also be fun and rewarding. You can use your creativity, observation, and scientific skills to make a unique and informative chart. You can also share your chart with others and teach them about the plant life cycle.
Are you ready to start your plant life cycle project? Then follow these five easy steps and grow your own plant life cycle anchor chart.
Step 1: Choose a Plant to Observe
The first step is to choose a plant that you want to observe for your project. You can choose any plant that has seeds and flowers, such as a bean, a sunflower, or a daisy. You can also choose a plant that you like or are curious about. Here are some criteria to help you choose a suitable plant for your project:
- The plant should be easy to grow and care for. You don’t want to spend too much time or money on your plant. You also don’t want to deal with pests or diseases that might affect your plant.
- The plant should germinate and grow fast. You don’t want to wait too long to see the changes in your plant. You also want to finish your project before the plant dies or withers.
- The plant should have visible and distinct stages. You want to be able to see and recognize the different stages of the plant life cycle. You also want to be able to label and describe each stage.
Once you have chosen a plant, you need to get some seeds to start your project. You can buy seeds from a store, collect seeds from nature, or save seeds from fruits or vegetables. Make sure the seeds are fresh and viable, meaning they can germinate and grow into healthy plants.
Step 2: Plant the Seeds and Monitor the Growth
The second step is to plant the seeds and monitor the growth of your plant. You need to provide the optimal conditions for your plant to germinate and grow, such as soil, water, light, and temperature. You can plant the seeds in a pot, a tray, or a cup. You can use potting soil, garden soil, or compost. You can place the pot in a sunny window, a balcony, or a garden. You can water the seeds regularly, but not too much or too little. You can also use a thermometer, a ruler, or a scale to measure the temperature, the height, or the weight of your plant.
As you plant the seeds and monitor the growth, you need to record the changes and developments of your plant. You can use different methods to record your plant, such as:
- Taking photos of your plant every day or every week. You can use a camera, a phone, or a tablet. You can also use a timer, a tripod, or a stand to take consistent and clear photos.
- Drawing sketches of your plant every day or every week. You can use a pencil, a pen, or a marker. You can also use a paper, a notebook, or a sketchbook. You can also use a ruler, a compass, or a protractor to draw accurate and proportional sketches.
- Measuring the height or the number of leaves of your plant every day or every week. You can use a ruler, a tape measure, or a string. You can also use a calculator, a spreadsheet, or a graph to calculate and display the data.
- Writing notes or descriptions of your plant every day or every week. You can use a paper, a notebook, or a journal. You can also use a computer, a word processor, or a blog. You can also use adjectives, verbs, or adverbs to write vivid and detailed notes.
You also need to label and date your records, so you can keep track of the time and the stage of your plant. You can use words, numbers, or symbols to label and date your records, such as:
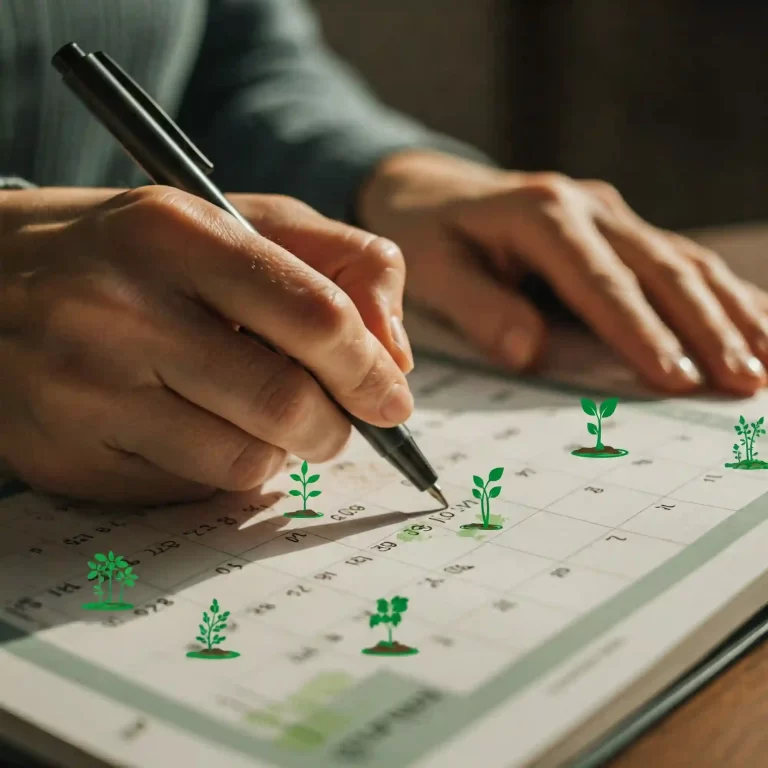
- Writing the date and the stage of your plant on each photo, sketch, measurement, or note. For example, you can write “April 1, 2023 – Seed”, “April 15, 2023 – Seedling”, or “May 1, 2023 – Flower”.
- Using a color code or a shape code to label and date your records. For example, you can use red for seed, green for seedling, yellow for flower, and blue for fruit. You can also use circles for seed, triangles for seedling, squares for flower, and stars for fruit.
- Using a sticker, a stamp, or a tag to label and date your records. For example, you can use a sticker with the date and the stage of your plant, a stamp with the date and the stage of your plant, or a tag with the date and the stage of your plant.
Step 3: Identify the Stages of the Plant Life Cycle
The third step is to identify the stages of the plant life cycle. The plant life cycle is the process of how a plant grows, reproduces, and dies. The plant life cycle has different stages, depending on the type of plant. However, most plants have the following basic stages:
- Seed: The seed is the first stage of the plant life cycle. The seed is a small and hard structure that contains the embryo of the plant. The seed can be dormant or active, meaning it can wait or start to germinate.
- Seedling: The seedling is the second stage of the plant life cycle. The seedling is a young and tender plant that emerges from the seed. The seedling has roots, stems, and leaves. The seedling can grow and develop into an adult plant.
- Adult: The adult is the third stage of the plant life cycle. The adult is a mature and strong plant that has reached its full size and shape. The adult has roots, stems, leaves, and flowers. The adult can produce and release seeds for reproduction.
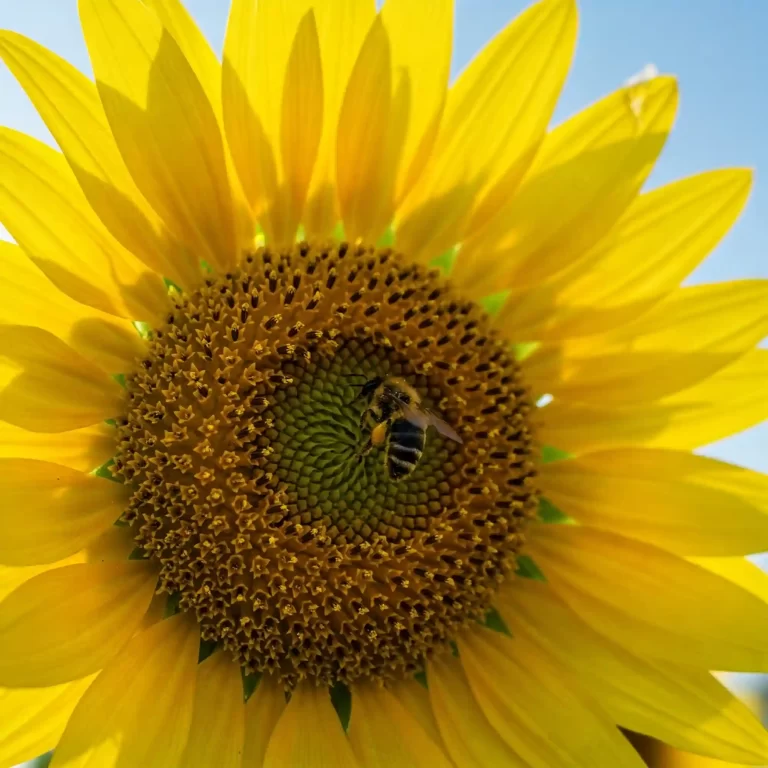
- Flower: The flower is the fourth stage of the plant life cycle. The flower is a colorful and fragrant structure that attracts pollinators, such as bees, butterflies, or birds. The flower has petals, sepals, stamens, and pistils. The flower can undergo pollination and fertilization to form fruits and seeds.
- Fruit: The fruit is the fifth stage of the plant life cycle. The fruit is a fleshy and juicy structure that protects and disperses the seeds. The fruit has skin, flesh, and seeds. The fruit can be eaten by animals, humans, or the plant itself. The fruit can also fall off or burst open to release the seeds.
- Dispersal: The dispersal is the sixth stage of the plant life cycle. The dispersal is the process of how the seeds are spread to new places. The dispersal can be done by wind, water, animals, humans, or the plant itself. The dispersal can help the seeds find a suitable place to germinate and grow into new plants.
- Death: The death is the last stage of the plant life cycle. The death is the end of the plant’s life. The death can be caused by natural factors, such as old age, disease, or drought. The death can also be caused by human factors, such as harvesting, cutting, or burning. The death can return the plant’s nutrients to the soil and complete the cycle.
You can use the records from step 2 to identify the stages of your plant’s life cycle. You can look for the signs of each stage, such as the appearance, the size, or the color of your plant. You can also use the tables below to compare the stages of different types of plants.
| Stage | Bean | Sunflower | Daisy |
|---|---|---|---|
| Seed | Small, oval, brown | Large, flat, black | Small, round, white |
| Seedling | Two cotyledons, one stem, two leaves | Two cotyledons, one stem, two leaves | Two cotyledons, one stem, two leaves |
| Adult | Many stems, many leaves, many flowers | One stem, many leaves, one flower | Many stems, many leaves, many flowers |
| Flower | White, purple, or pink, pea-shaped | Yellow, large, disk-shaped | White, yellow, or pink, daisy-shaped |
| Fruit | Green, long, pod-shaped | Brown, round, head-shaped | Brown, oval, achene-shaped |
| Dispersal | Splitting, wind, animals | Shattering, wind, animals | Detaching, wind, animals |
| Death | Browning, wilting, decaying | Browning, wilting, decaying | Browning, wilting, decaying |
| Stage | Air Plant | Cactus | Orchid |
|---|---|---|---|
| Seed | Small, round, black | Small, round, black | Small, dust-like, brown |
| Seedling | One stem, one leaf, no roots | One stem, one spine, no leaves | One stem, one leaf, one root |
| Adult | Many stems, many leaves, no roots | Many stems, many spines, few flowers | Many stems, many leaves, many roots |
| Flower | Purple, pink, or red, spike-shaped | White, yellow, or pink, cup-shaped | White, yellow, or pink, orchid-shaped |
| Fruit | Brown, round, capsule-shaped | Green, round, berry-shaped | Green, oval, capsule-shaped |
| Dispersal | Bursting, wind, water | Falling, water, animals | Bursting, wind, water |
| Death | Browning, shriveling, rotting | Browning, shriveling, rotting | Browning, shriveling, rotting |
Step 4: Create the Plant Life Cycle Anchor Chart
The fourth step is to create the plant life cycle anchor chart. You need to design and make the anchor chart using the records from step 2 and the information from step 3. You can choose any format, layout, or material for your anchor chart, such as:
- Format: You can make your anchor chart in a circular, linear, or branching format. A circular format shows the cycle as a loop, a linear format shows the cycle as a line, and a branching format shows the cycle as a tree.
- Layout: You can make your anchor chart in a horizontal, vertical, or diagonal layout. A horizontal layout shows the cycle from left to right, a vertical layout shows the cycle from top to bottom, and a diagonal layout shows the cycle from corner to corner.
- Material: You can make your anchor chart using paper, cardboard, or fabric. You can also use other materials, such as wood, metal, or plastic.
You also need to use the records from step 2 to illustrate the stages of the plant life cycle on your anchor chart. You can use different methods to illustrate your plant, such as:
- Using photos of your plant. You can cut out the photos and glue them on your anchor chart. You can also print the photos and stick them on your anchor chart.
- Using drawings of your plant. You can draw the plant on your anchor chart using a pencil, a pen, or a marker. You can also trace the plant on your anchor chart using a stencil, a template, or a projector.
- Using cut-outs of your plant. You can cut out the shapes of your plant from paper, cardboard, or fabric. You can also use other materials, such as felt, foam, or clay.
You also need to add labels, captions, or arrows to your anchor chart to explain the stages of the plant life cycle. You can use words, numbers, or symbols to add labels, captions, or arrows, such as:
- Using words to name and describe each stage of the plant life cycle. For example, you can write “Seed”, “Seedling”, “Adult”, “Flower”, “Fruit”, and “Dispersal”. You can also write some details about each stage, such as the appearance, the size, or the color of the plant.
- Using numbers to order and count each stage of the plant life cycle. For example, you can write “1”, “2”, “3”, “4”, “5”, and “6”. You can also write some data about each stage, such as the duration, the frequency, or the quantity of the plant.
- Using symbols to show and connect each stage of the plant life cycle. For example, you can use circles, triangles, squares, stars, and arrows. You can also use other symbols, such as hearts, flowers, fruits, or seeds.
Step 5: Display and Share the Plant Life Cycle Anchor Chart
The fifth and final step is to display and share the plant life cycle anchor chart. You need to find a suitable place, time, and audience for your anchor chart. You can display and share your anchor chart in different ways, such as:
- Finding a place to hang or place your anchor chart. You can hang your anchor chart on a wall, a door, or a window. You can also place your anchor chart on a table, a shelf, or a stand.
- Finding a time to show or present your anchor chart. You can show your anchor chart during a class, a meeting, or a workshop. You can also present your anchor chart during a fair, a festival, or a contest.
- Finding an audience to view or learn from your anchor chart. You can view your anchor chart with your friends, family, or classmates. You can also teach your anchor chart to your students, colleagues, or visitors.
You also need to use your anchor chart to teach or learn about the plant life cycle. You can use different methods to teach or learn from your anchor chart, such as:
- Asking questions about the plant life cycle. You can ask yourself or others questions about the plant life cycle, such as “What are the stages of the plant life cycle?”, “How does the plant change and reproduce?”, or “Why is the plant life cycle important?”.
- Explaining concepts about the plant life cycle. You can explain yourself or others concepts about the plant life cycle, such as “The plant life cycle is the process of how a plant grows, reproduces, and dies.”, “The plant life cycle has different stages, depending on the type of plant.”, or “The plant life cycle is influenced by many factors, such as the environment, the season, or the pollinators.”.
- Comparing plants with different life cycles. You can compare yourself or others plants with different life cycles, such as “How are the life cycles of a bean, a sunflower, and a daisy similar and different?”, “How are the life cycles of an air plant, a cactus, and an orchid similar and different?”, or “How are the life cycles of a plant and an animal similar and different?”.
You also need to get some feedback on your plant life cycle anchor chart. You can get some feedback from yourself or others on your anchor chart, such as:
- Adding details to your anchor chart. You can add more details to your anchor chart, such as more photos, drawings, or cut-outs of your plant, more labels, captions, or arrows to your anchor chart, or more words, numbers, or symbols to your anchor chart.
- Correcting errors on your anchor chart. You can correct any errors on your anchor chart, such as spelling, grammar, or punctuation errors, inaccurate or incomplete information, or unclear or confusing illustrations.
- Updating information on your anchor chart. You can update any information on your anchor chart, such as new or changed stages of your plant, new or changed data of your plant, or new or changed symbols of your plant.
Conclusion
Congratulations! You have completed your plant life cycle project and created your own plant life cycle anchor chart. You have learned how to choose a plant, plant the seeds, monitor the growth, identify the stages, create the anchor chart, display and share the anchor chart, and get feedback on the anchor chart. You have also learned more about the plant life cycle and enhanced your creativity, observation, and scientific skills.
We hope you enjoyed this article and found it useful for your project. If you did, please share your results, ask questions, or leave comments below. We would love to hear from you and see your plant life cycle anchor charts. Thank you for reading and happy planting!


[…] it as a bank account perpetually drained, with nothing left to invest in growth. Root systems, the anchors of plant life, are left gasping for air, choked by compacted soil. Yields dwindle, flowers bloom shyly, and the […]